0
Step By Step: Turn On The iPhone/iPad’s Web Debugging Console
Posted in JavaScript at 二月 29th, 2012 / No Comments »
You can’t view a web page’s source, and you can’t Command+F to search for text on the page, but you sure can get a debugging console to see the errors on the page. Here’s how:
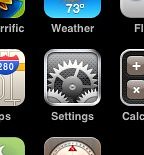
- Find and open the Settings app
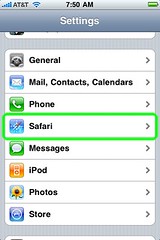
- Select Safari
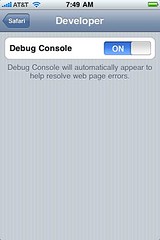
- Scroll down to find the Developer option at the bottom
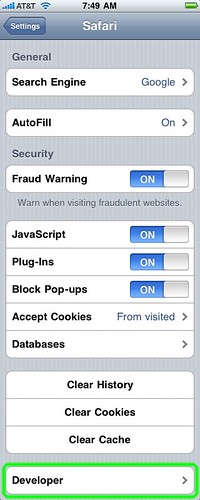
- Turn on the Debug Console
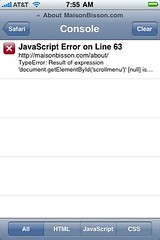
- In Safari, look for the debug console’s summary info at the top of the page, just below the URL bar
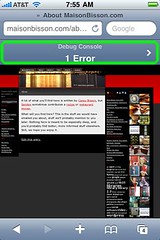
- Touch the summary info to view a detailed report for the errors on the page